
Using Tableau with the Data Connector
Learn how to work with Bipsync data to create visualisations within Tableau
To connect Tableau Desktop to your Bipsync database, open the app and in the Connect menu on the left hand side, choose "To a Server" > "More...". The following list of possible connection sources should appear:

Choose "Amazon Aurora for MySQL". If you don't have ODBC drivers for MySQL installed, Tableau will prompt you to install them and provide instructions for doing so, and you'll need to restart Tableau Desktop. If you do have ODBC drivers installed a dialog will appear into which you can enter the ODBC credentials you obtained from Bipsync's Setup app.
SSL RequirementNote that some versions of Tableau may require the Secure Sockets Layet (SSL) option to be enabled in order for a database connection to succeed. See this page for more details.
The certificate you need can be found at this address.
Submit the form and after a short period, Tableau should connect and open a new workbook. From the dropdown of database snapshots on the left hand side, choose the database you wish to work with. You're now able to use data from Bipsync database tables within Tableau.

Depending on how long RAP has been active, you should see a few databases in the list. Generally the last three snapshots are available, with timestamps appended to the database name that indicate when the snapshot was taken. An entry with the _latest suffix will always point to the latest dataset, and this is usually the one you should integrate with assuming you'd like your visualisations to update automatically.
Creating your first Bipsync data visualisation
We'll start simple by creating a simple chart that illustrates the number of notes each user has created within the system.
In the table browser on the left hand side of Tableau Desktop, click the magnifying glass and search for research:
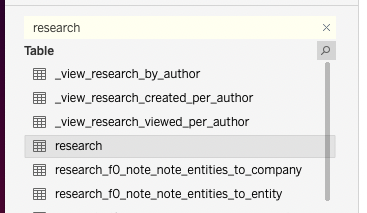
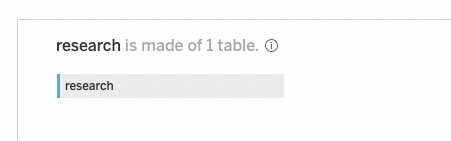
Drag that table into the space on the right, and then double click on it to open it:
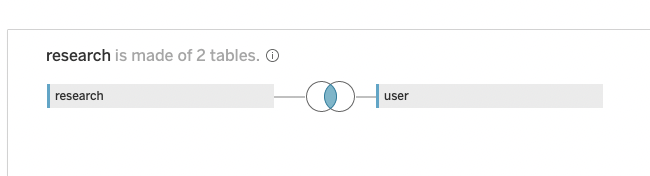
Return to the table browser, search for user, and then drag that table over and alongside the research table. You should see the following view:
Click the overlapping circles between the two tables, and configure the join like so, setting the left hand side of the join to reference the research table's User column:
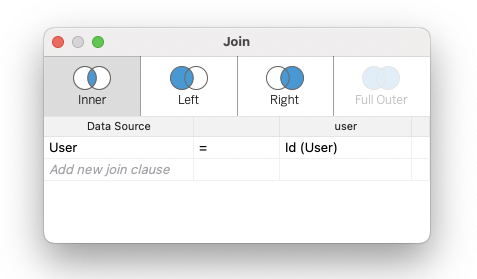
This configuration will provide the data we need.
Create a new Worksheet (Worksheet -> New Worksheet), and find the Id (User) field in the list:
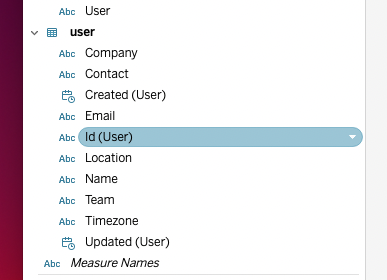
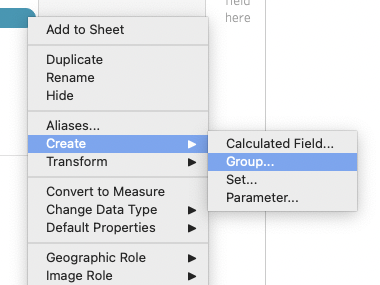
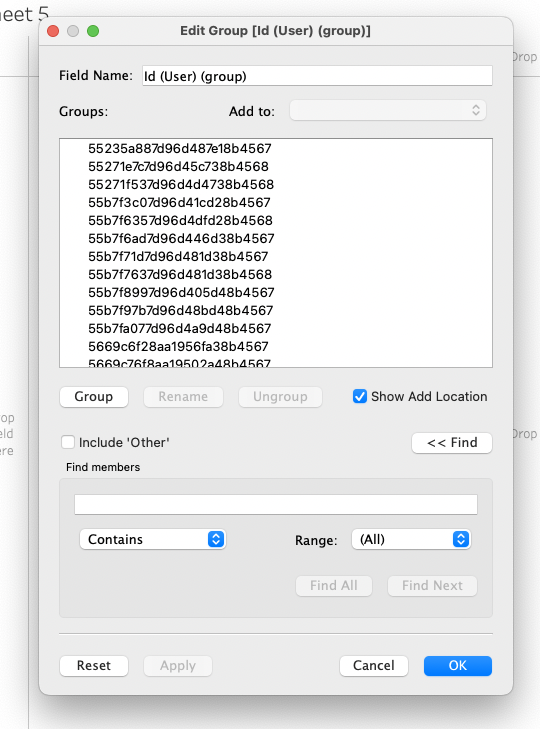
Click the arrow alongside its name, or right-click, to open its context menu. Select Create -> Group... and click OK in the screen that appears:
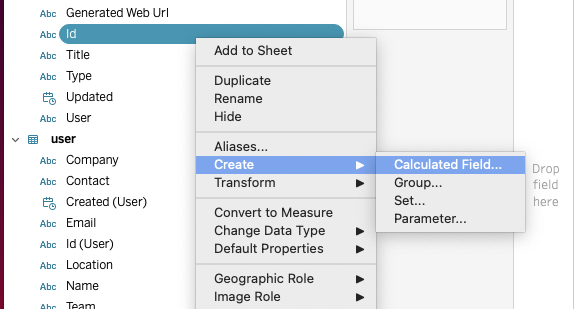
Return to the table list and find the Id field under research. Access its menu and choose Create -> Calculated Field..., and in the screen that opens, choose the Name field and click OK:
Next, find the field named Id under the research table. Open its menu and choose the Create -> Calculated Field... option:
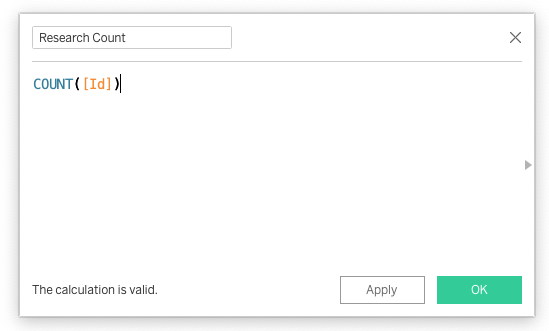
Name it Research Count and wrap the value in a Count() expression, and click OK:
We're ready to put the chart together.
Drag the Id (User)(group) field into the columns section, and the Research Count field into the rows section.
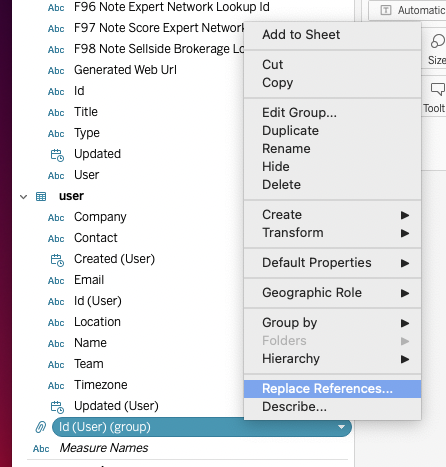
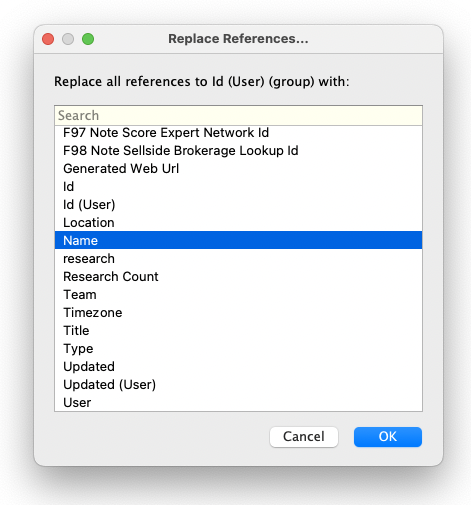
In the chart that appears, you'll notice that the users are identified by their IDs instead of their names. To fix this, find the field (if you didn't rename it it'll be called Id (User)(group)) in the list and open its menu. Choose Replace References... and in the screen that opens, choose Name and click OK:

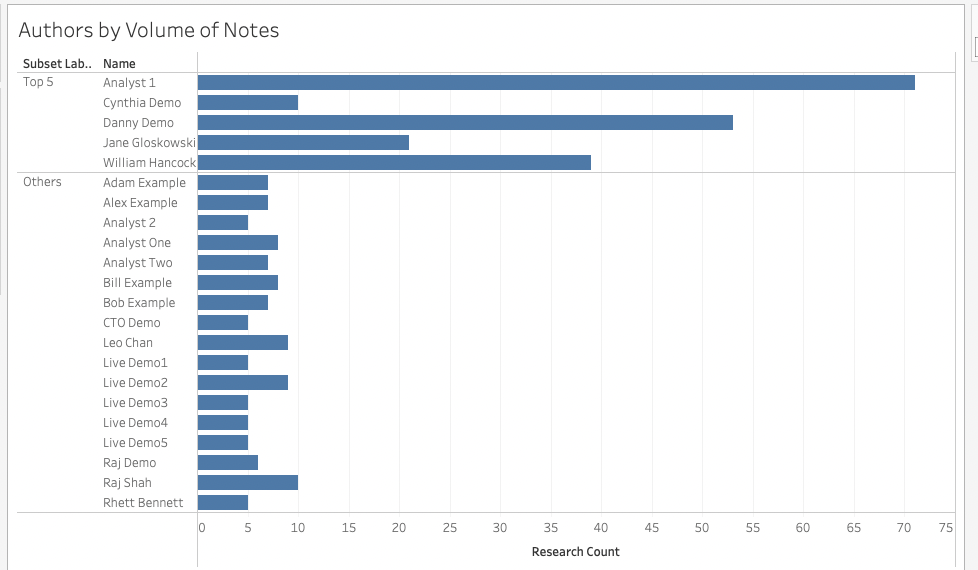
The chart should now look like this:
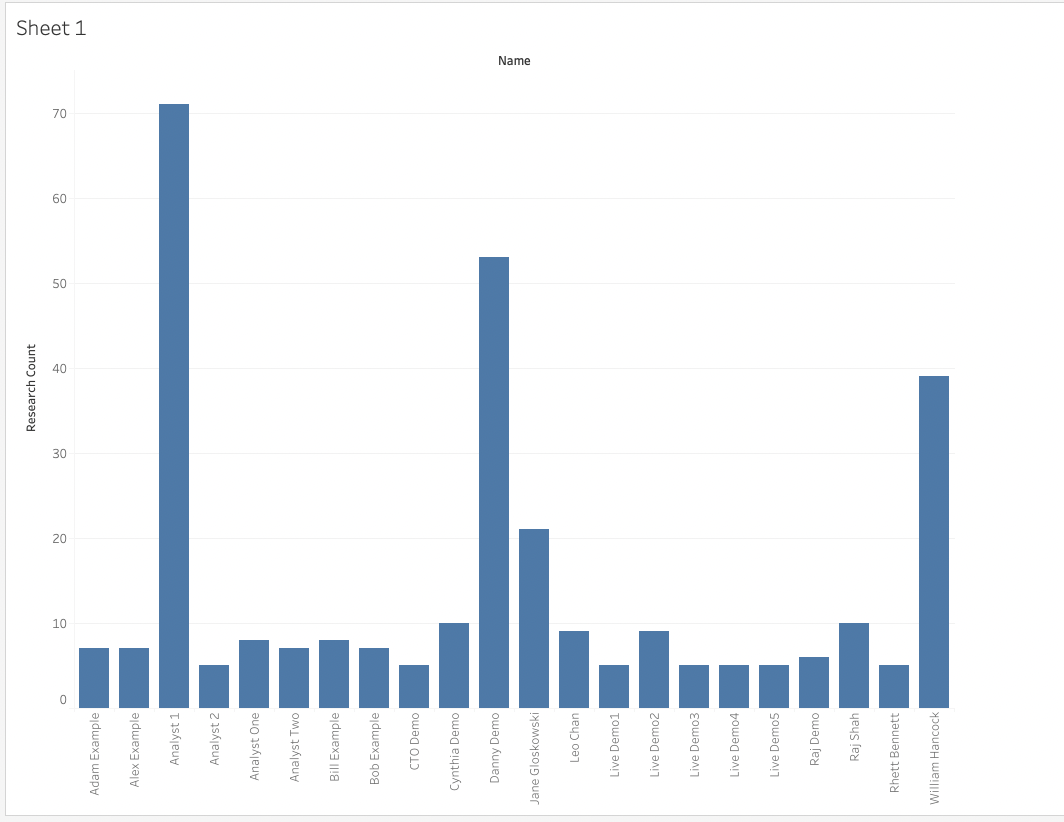
From here you could customise this chart further, for example by adding filters to limit results to a given date range, or using Tableau "Sets" to show the authors with the most notes:
This is a simple example but it should serve to highlight the possibilities of working with Bipsync data within Tableau to create insightful diagrams and charts.
Tips and Tricks
- Use date filters wherever possible to limit the amount of data that Tableau attempts to process. This will improve the speed at which charts can be rendered.
- Tableau can attempt to format date fields in a way causes an error. To fix this, set the date as an Exact Date and then as Discrete rather than Continuous.