
Using Microsoft Power BI with the Data Connector
Learn how to work with Bipsync data to create reports and charts within Power BI
Install ODBC driversBefore working with Power BI, you'll need to have installed ODBC drivers for MySQL on your Windows machine. These can be obtained here: https://dev.mysql.com/downloads/connector/odbc/.
Create a DSN to the RAP database
With ODBC drivers installed, open the ODBC Data Source Administrator application. Make sure you use the correct architecture (32/64bit) for the version of Office you have installed.
- Within the app, under "User DSN" click on the Add... button. The 'Create New Data Source' dialog displays, enabling you to add a new DSN.
- Select a MySQL ODBC Driver from the list of drivers. If you're given the option, choose a Unicode driver. Click on the Finish button.
- The 'MySQL Connector/ODBC' dialog displays
- Enter these configuration details:
- A data source name for the connection
- A description (optional)
- The host address of the database server
- Your user name and password
- The database name on the selected server (ask your CSM for this if you're not sure)
- To configure advanced options, click on the Details>> button.
- Select these checkboxes (where provided):
- Return matched rows instead of affected rows ('Connection' or 'Cursors/Results' tab)
- Allow big result sets ('Connection' tab)
- Click on the Test Connection button to confirm that the details are correct.
Create a chart in Power BI
Let's create a simple chart which illustrates the Asset Classes within which invested Funds reside.
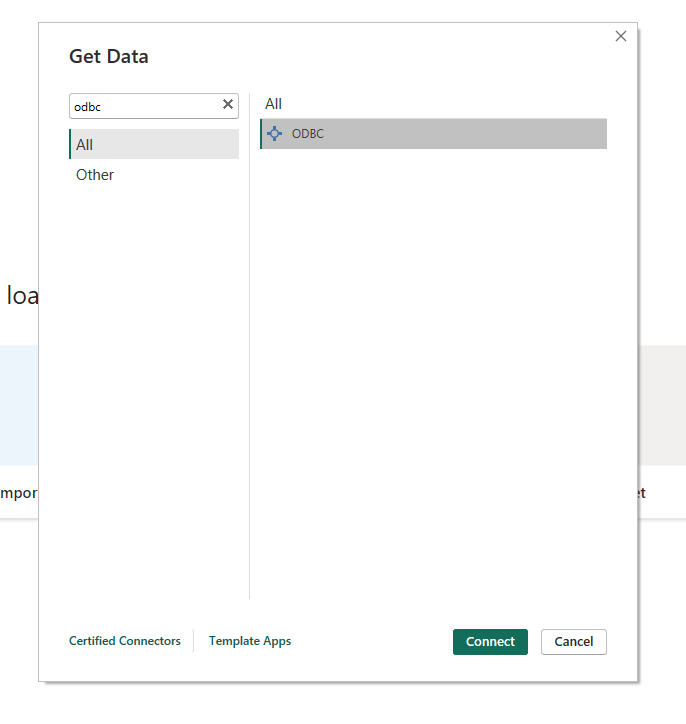
First, from the Data tab click "Get Data..." and then choose the ODBC source:
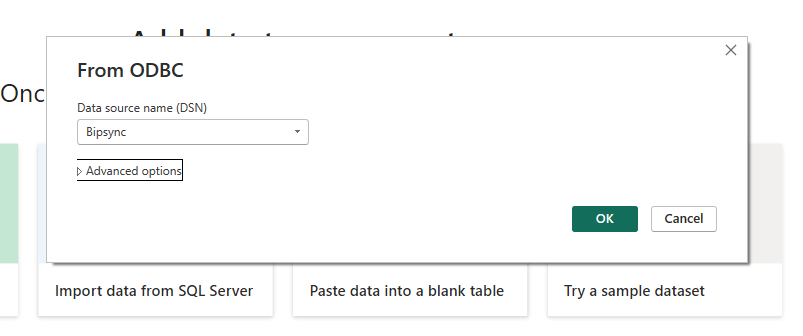
Next, choose the Bipsync RAP data source which was configured earlier:
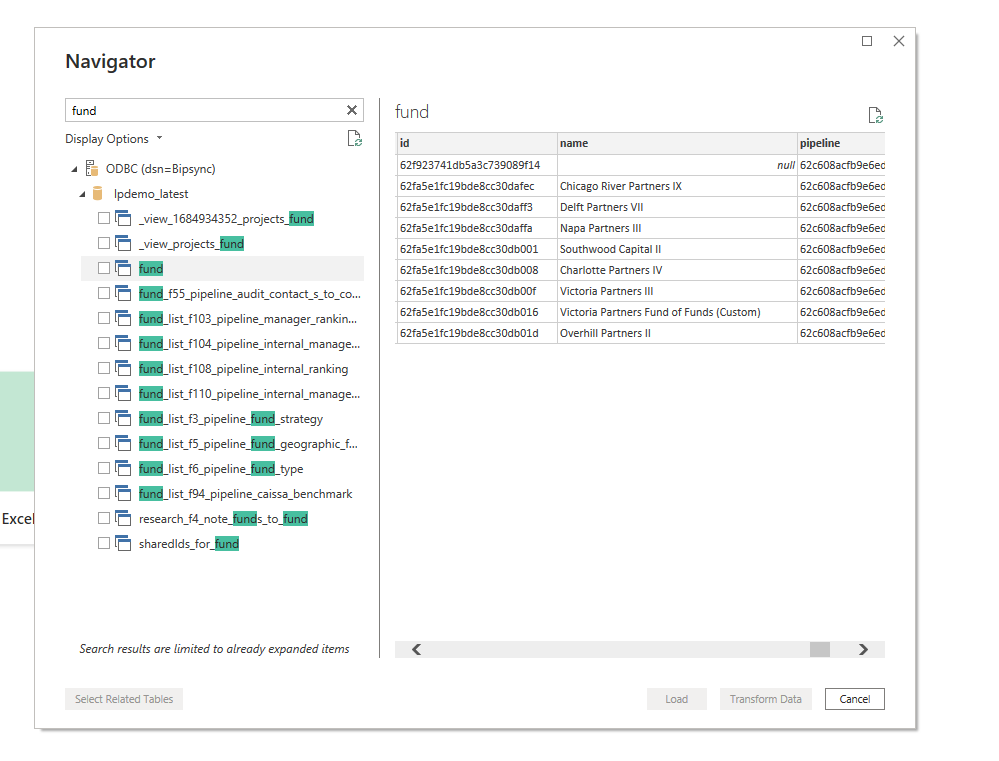
If the connection is successful, the Navigator window will appear and list the RAP databases that are accessible. From here, we choose the tables that we're interested in reporting on — in our example, we'll need the Fund and Asset Class tables.
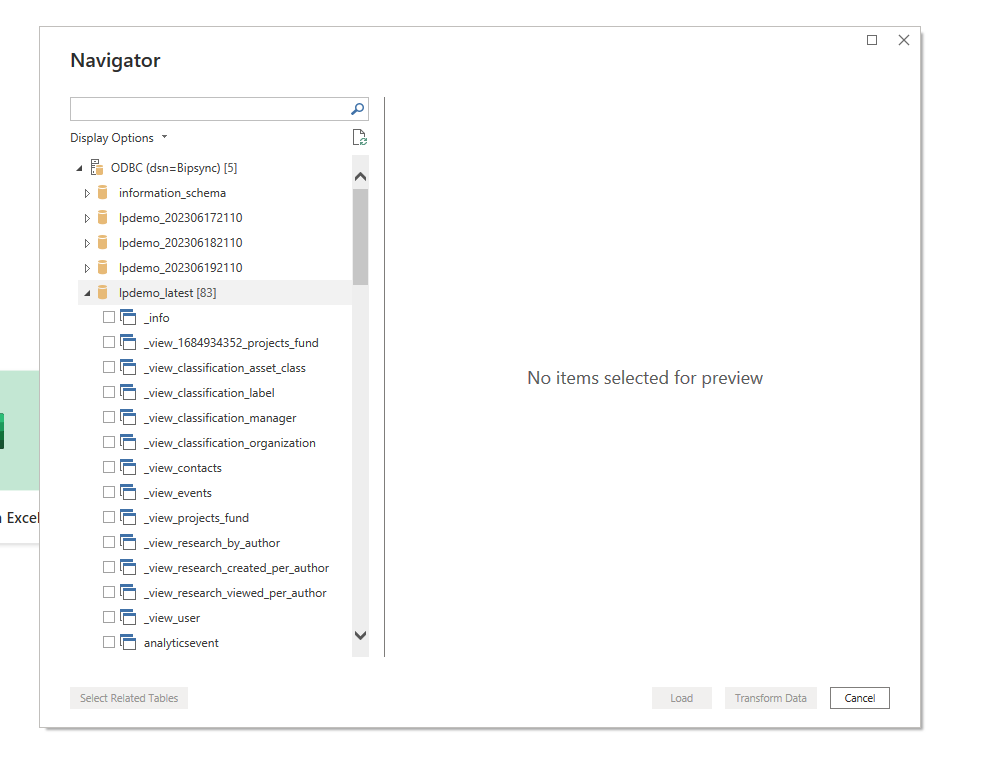
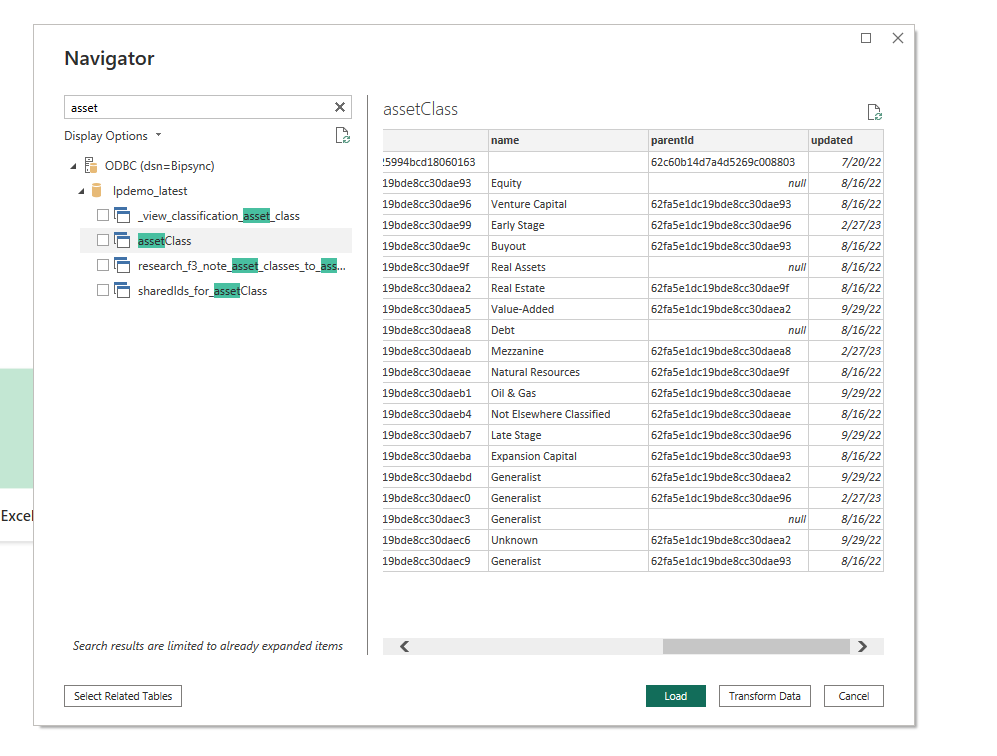
With those tables selected, we click the "Load" button to make that data available to Power BI.
Now we need to establish a relationship between these tables. Still in the Data tab, click the "Relationships..." button:
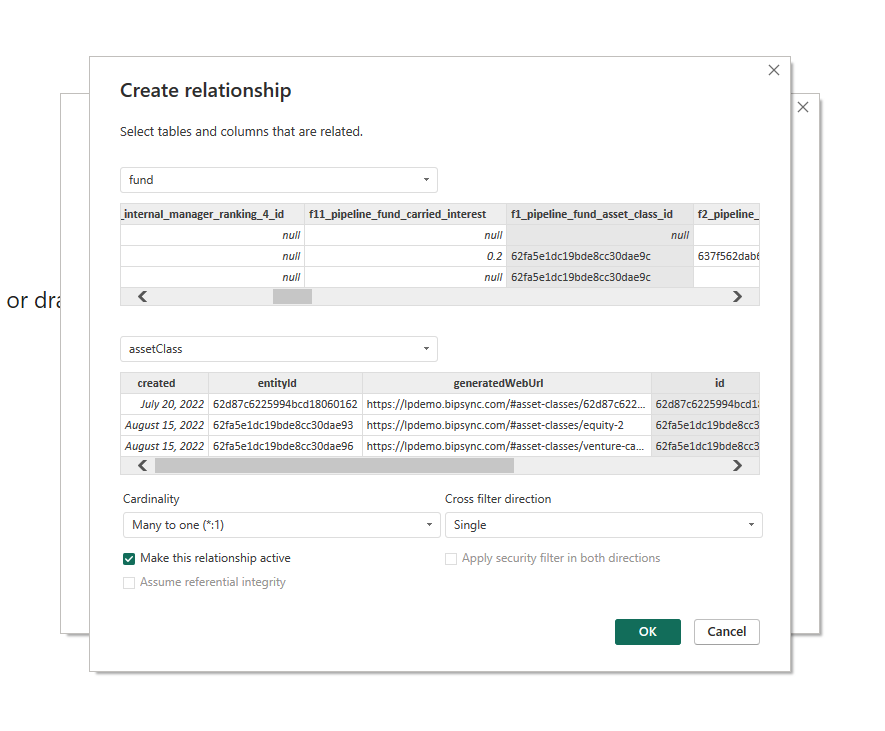
We associate the Asset Class ID column in the funds table with the ID column in the asset class table, and click OK.
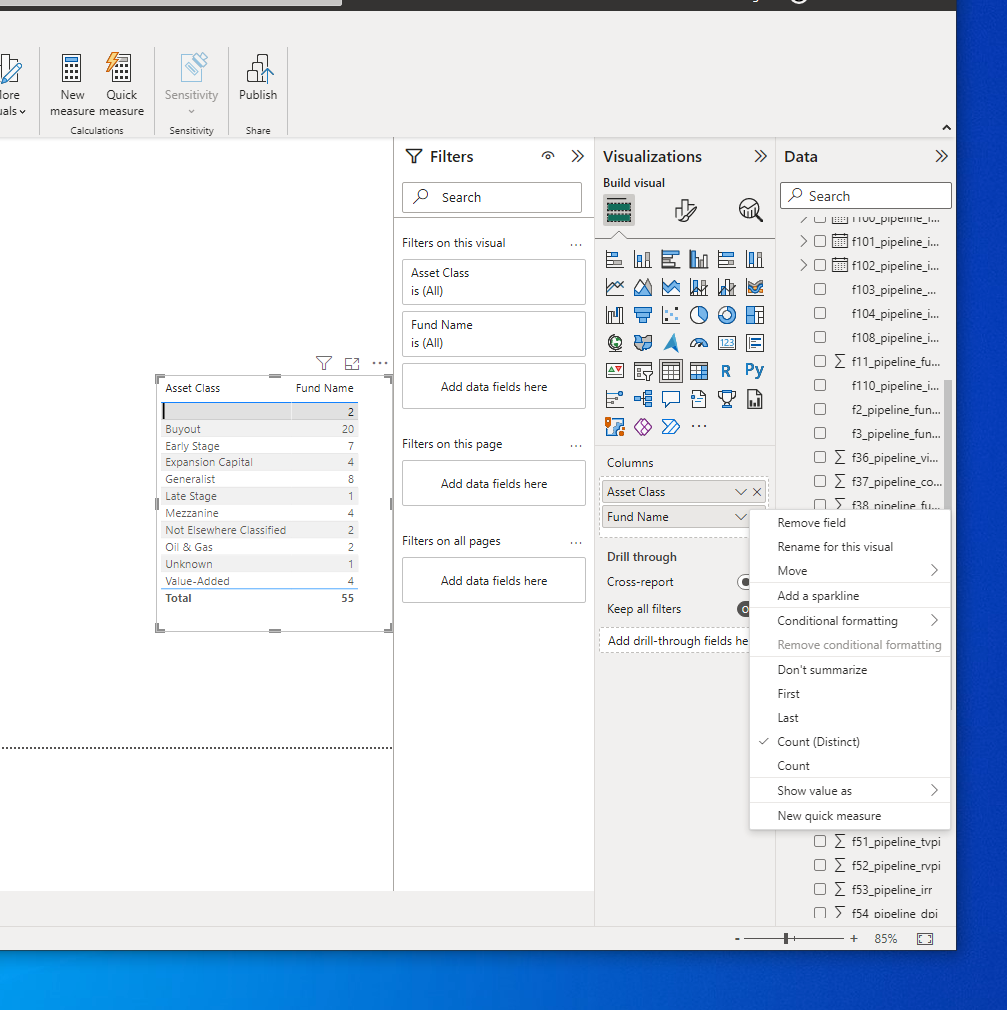
Now we create our chart. First we drag the Asset Class name column into the Visualisation view. Then we drag the Fund Name column in alongside it, and finally right-click the fund name column in the column list, and set its display type to "Count (Distinct)":
Finally, we choose a Pie Chart visualization type from the Visualizations menu, and configure the display labels appropriately. This gives us the chart below:
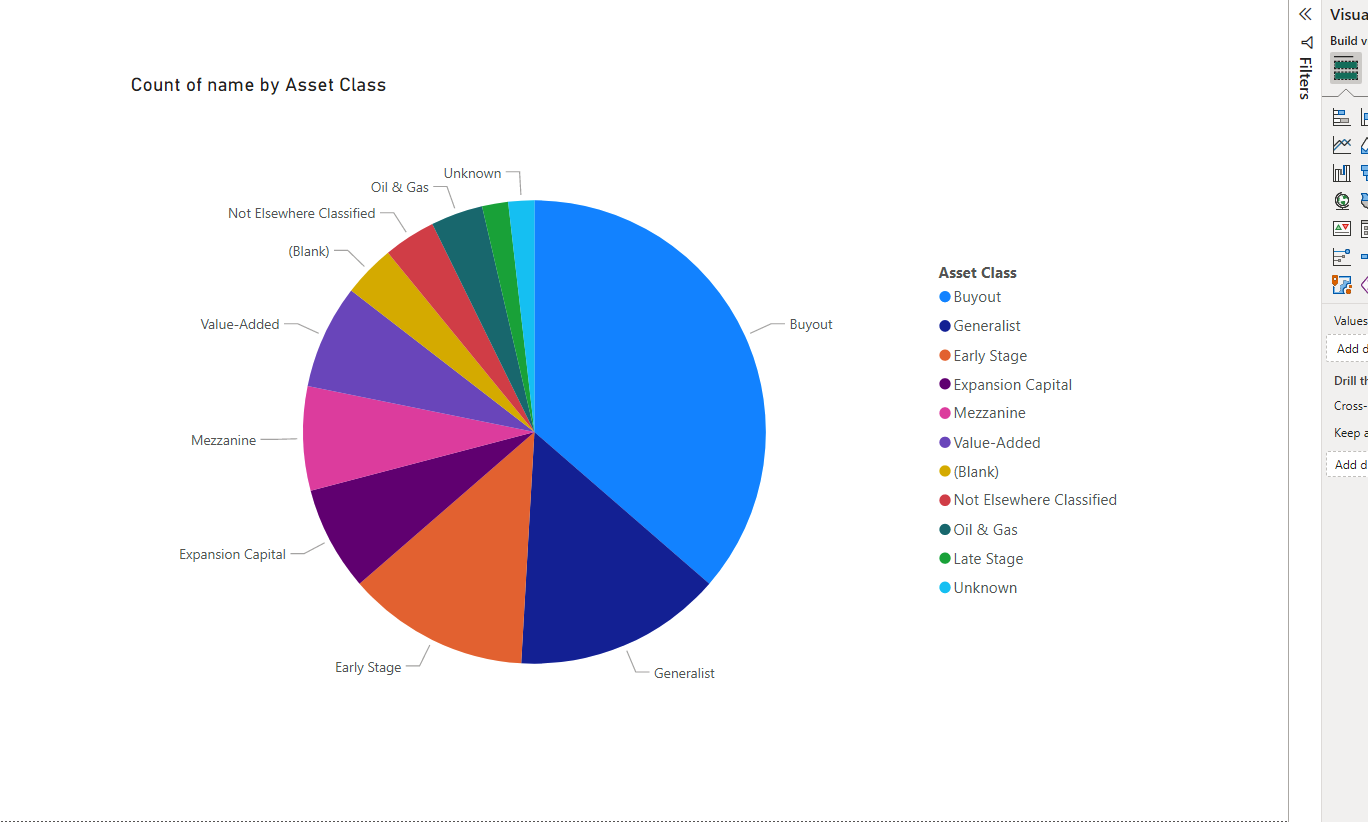
This simple approach can be used with other types of Bipsync data, from research to portfolio investments and even analytics. It's a good example of how Power BI can quickly give insight into the investment data held within Bipsync.
Updated 11 months ago